

No Budget? No Problem! Best Open Source Network Monitoring Systems
Why Open-Source Network Monitoring Matters for Your Business
Network monitoring system open source solutions are powerful alternatives to expensive commercial tools. Platforms like Zabbix are used in over 300,000 deployments, while Prometheus is the standard for cloud-native environments.
Top Open-Source Network Monitoring Systems:
- Zabbix – Universal monitoring for IT & OT with pre-built templates
- Nagios Core – Industry standard with extensive plugin ecosystem
- Prometheus – Time-series database perfect for cloud and Kubernetes
- Icinga – Modern Nagios fork with REST API and web interface
- Cacti – RRDTool-based graphing with SNMP focus
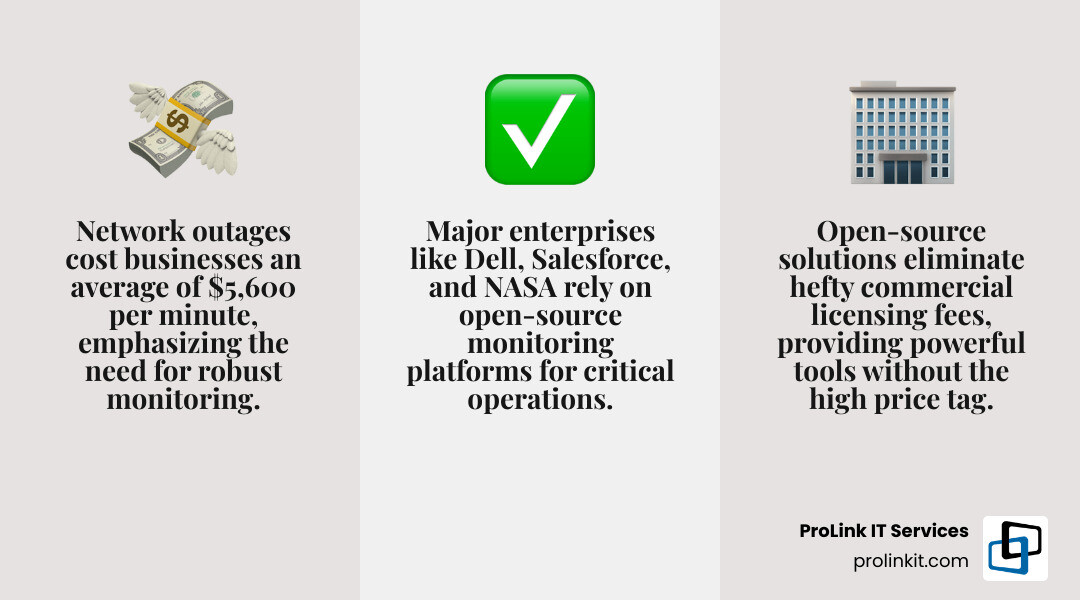
Network outages cost businesses an average of $5,600 per minute, yet many skip proper monitoring due to the high licensing fees of commercial software. Open-source tools eliminate this barrier, providing core functionality like device findy, performance tracking, and alerting without the price tag.
The benefits go beyond cost:
- Complete customization to fit your exact needs
- No vendor lock-in or licensing restrictions
- Transparent code you can audit and modify
- Active communities driving constant innovation
These aren’t hobbyist projects; major enterprises like Dell, Salesforce, and NASA rely on open-source monitoring. The main challenge is that these tools require technical expertise to implement correctly, which is where expert guidance makes a difference.
I’m Mitch Johnson, founder of ProLink IT Services. I’ve spent over 20 years helping businesses implement effective network monitoring system open source solutions, from small setups to complex enterprise deployments.
Network monitoring system open source terms you need:
Why Choose Open-Source Network Monitoring?
When your network goes down, every minute costs money, but commercial monitoring tools often have prohibitive price tags. This is where network monitoring system open source solutions shine. Once seen as a “budget option,” they are now serious enterprise contenders.
Cost-effectiveness is the main draw. With no licensing fees, the Total Cost of Ownership (TCO)—including hardware, setup, and maintenance—is significantly lower. For example, Zabbix offers predictable support pricing without the surprise license upgrades common with commercial tools.
Beyond cost, open-source provides freedom. No vendor lock-in means you control your own roadmap. Need a specific feature or integration? You can build it yourself. The ability to customize is endless because you have access to the source code. This transparency is also vital for security audits.
Another key benefit is community-driven innovation. Thousands of developers contribute to these projects, often releasing fixes and features faster than traditional vendors. Cacti’s community forum, for instance, has over 160,000 posts from users sharing solutions.
However, there are challenges. A learning curve exists, as these tools require technical skills in Linux, databases, and networking. They aren’t always plug-and-play. Support models also differ; while community forums are valuable, guaranteed support often requires paid professional services.
Despite this, many tools like Zabbix have become much more user-friendly. Network monitoring system open source tools offer incredible value, power, and flexibility when implemented with the right expertise.
If you need expert guidance on implementation, our Managed Network Services team can help you get the most out of these powerful tools.
Key Features to Evaluate in an Open-Source Tool
Choosing a network monitoring system open source solution means finding the right features for your needs. Certain capabilities can make or break your monitoring experience.
-
Auto-findy: This is a major time-saver. The best tools automatically scan your network to identify and inventory devices like servers, switches, and routers. This is crucial for growing or dynamic networks.
-
Network mapping and visualization: A clear visual map of your network topology provides a “single pane of glass” view. It helps you quickly spot connections, dependencies, and bottlenecks. Zabbix excels at creating detailed maps and dashboards.
-
SNMP monitoring: Simple Network Management Protocol (SNMP) is the backbone of network monitoring. It allows your tool to collect performance data like CPU usage, memory, and bandwidth from devices. Tools like Cacti are built on strong SNMP capabilities.
-
Alerting mechanisms: Effective monitoring requires knowing when something breaks. Look for flexible alert configurations with customizable thresholds. Your system should send email notifications for standard issues and SMS notifications for critical failures. Prometheus’s Alertmanager is excellent at this, integrating with services like PagerDuty.
-
Reporting and visualization: Beyond real-time dashboards, you need historical reports for trend analysis and capacity planning. The ability to create custom dashboards and review historical data is key. The combination of Prometheus and Grafana offers powerful data visualization.
-
Scalability: Your chosen tool must grow with your business, whether you have ten devices or thousands. Zabbix is proven to scale to 15,000 hosts, while OpenNMS can handle tens of thousands of data points.
-
Integration capabilities and APIs: Your monitoring tool shouldn’t be an island. Robust APIs allow integration with ITSM platforms, databases, and custom scripts, creating a unified workflow. The flexibility of open-source often leads to a wider range of community-developed integrations.
Focus on the features that will genuinely help you maintain a smooth and secure network. To learn more about security, check out our 7 Top Network Security Tips for Businesses to align your monitoring with your security strategy.
The Best Open Source Network Monitoring Systems
There is no single best network monitoring system open source solution; the right choice depends on your needs, expertise, and infrastructure. Here are five of the most powerful and widely-adopted systems, each proven in real-world deployments.
| Tool | Primary Use Case | Ease of Setup (Learning Curve) | Scalability | Visualization |
|---|---|---|---|---|
| Zabbix | Universal IT & OT monitoring, enterprise-grade | Moderate to High (improving) | Highly scalable (tens of thousands of devices) | Excellent (customizable dashboards, network maps) |
| Nagios Core | Core infrastructure monitoring, highly customizable | High (configuration files) | Good (with proper architecture) | Basic (requires add-ons like NagiosGraph) |
| Icinga | Modern infrastructure monitoring, Nagios fork | Moderate | Good | Good (built-in web interface, Graphite/InfluxDB) |
| Prometheus | Cloud-native, container, time-series data | Moderate | Excellent for dynamic, ephemeral environments | Excellent (especially with Grafana) |
| Cacti | Network graphing, historical performance data | Moderate | Good for performance data collection | Excellent for time-series graphing |
Zabbix: A Universal open source network monitoring system
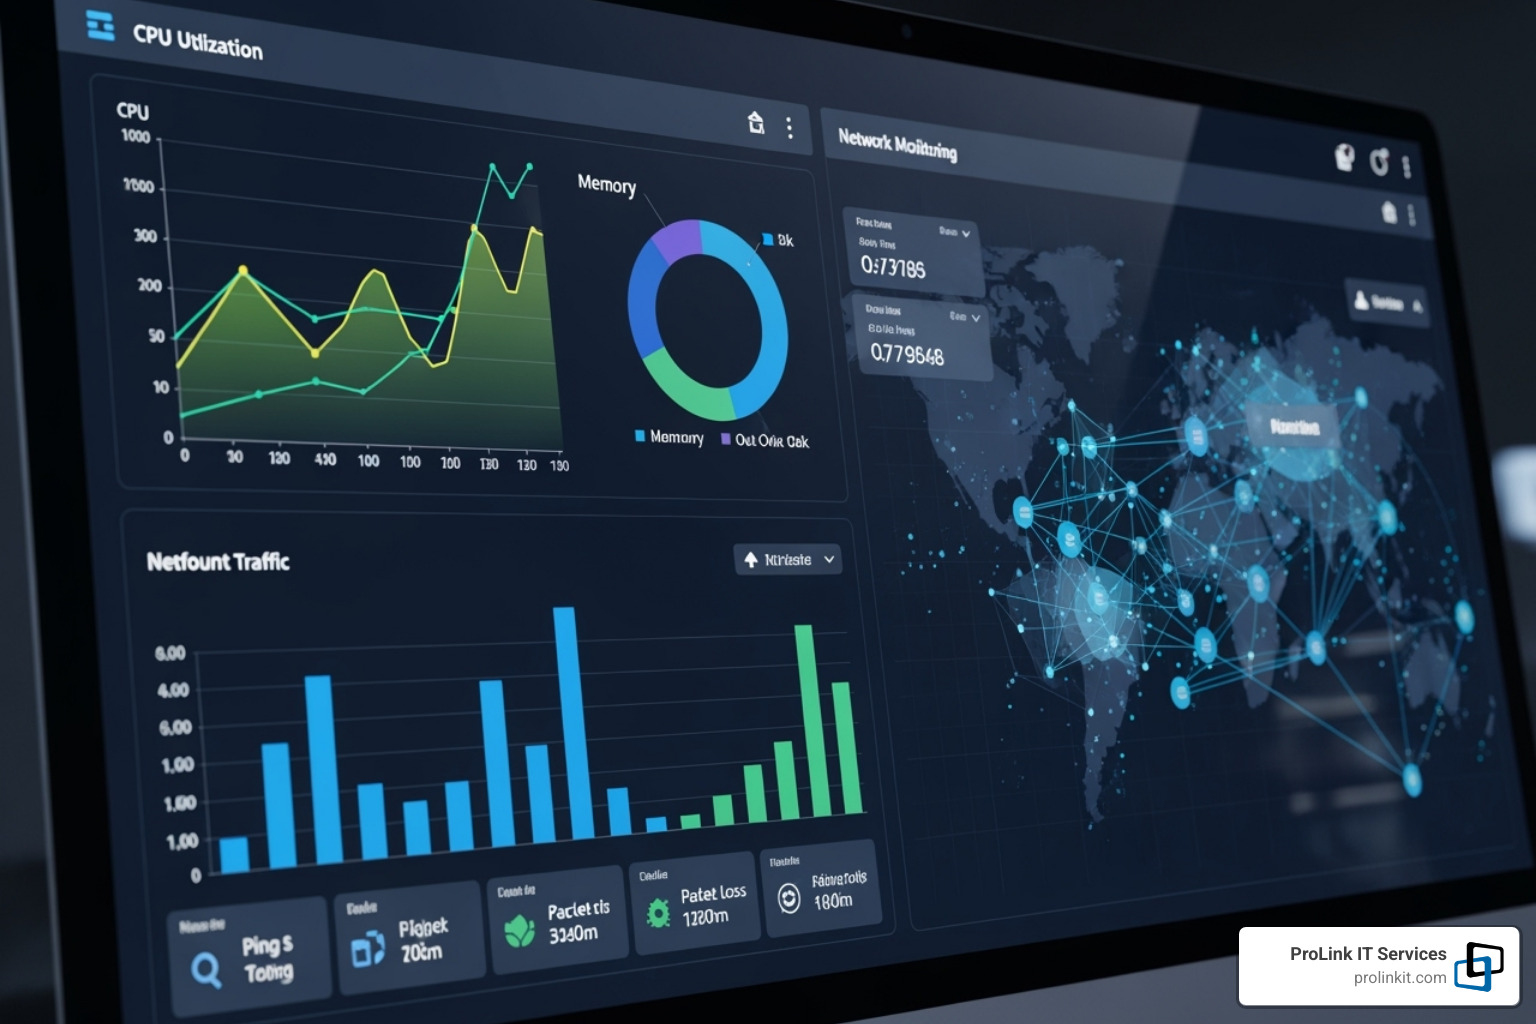
Zabbix is a versatile network monitoring system open source that can handle everything from office routers to servers, applications, and industrial control systems. Its universal approach makes it a favorite for enterprises like Dell and Salesforce.
Pre-built templates are a major time-saver, and the Zabbix Community Templates repository offers thousands of shared configurations. Scalability is a key strength; Zabbix can monitor over 15,000 hosts. For large deployments, PostgreSQL with TimescaleDB is the recommended backend. Its visualization is also impressive, with customizable dashboards and network maps. Zabbix is even used to monitor the Columbus lab aboard the International Space Station, as detailed in the European Space Agency Case Study.
Nagios Core: A Powerful open source network monitoring system
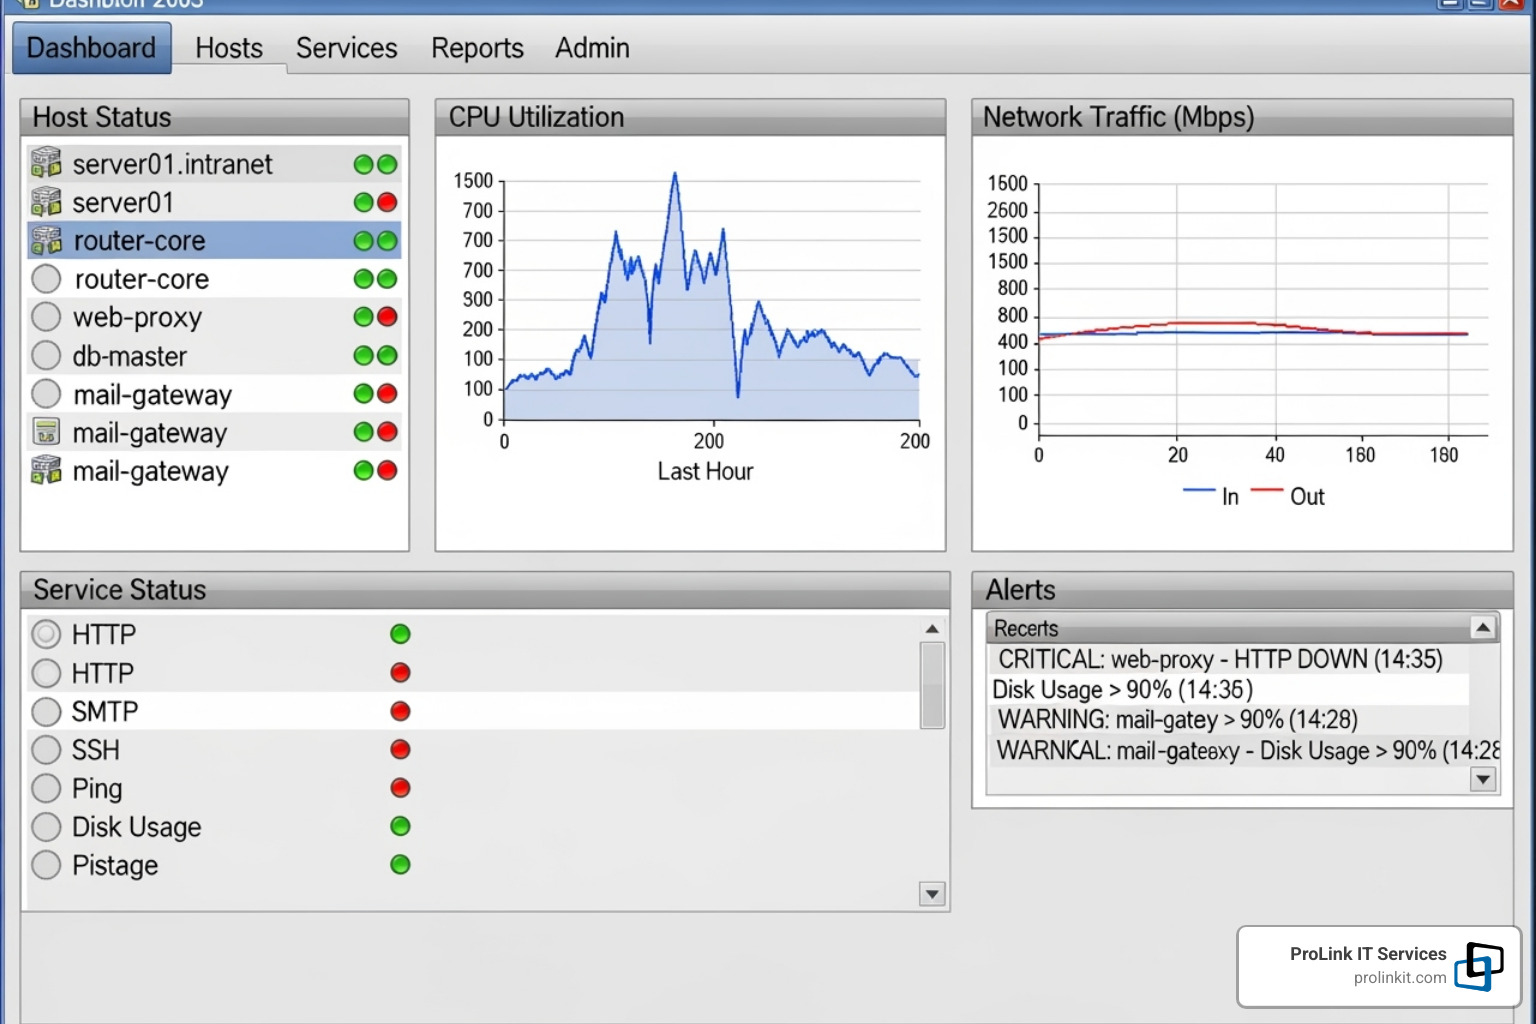
As an industry standard for over 20 years, Nagios Core offers unparalleled control and flexibility. If you can script a check, Nagios can monitor it. This has led to a massive ecosystem of plugins on the Nagios Exchange. The trade-off is complexity; Nagios relies on text-based configuration files, requiring comfort with the command line. While its native visualization is basic, it integrates well with third-party graphing tools. Explore more at the Nagios Core Project Page.
Icinga
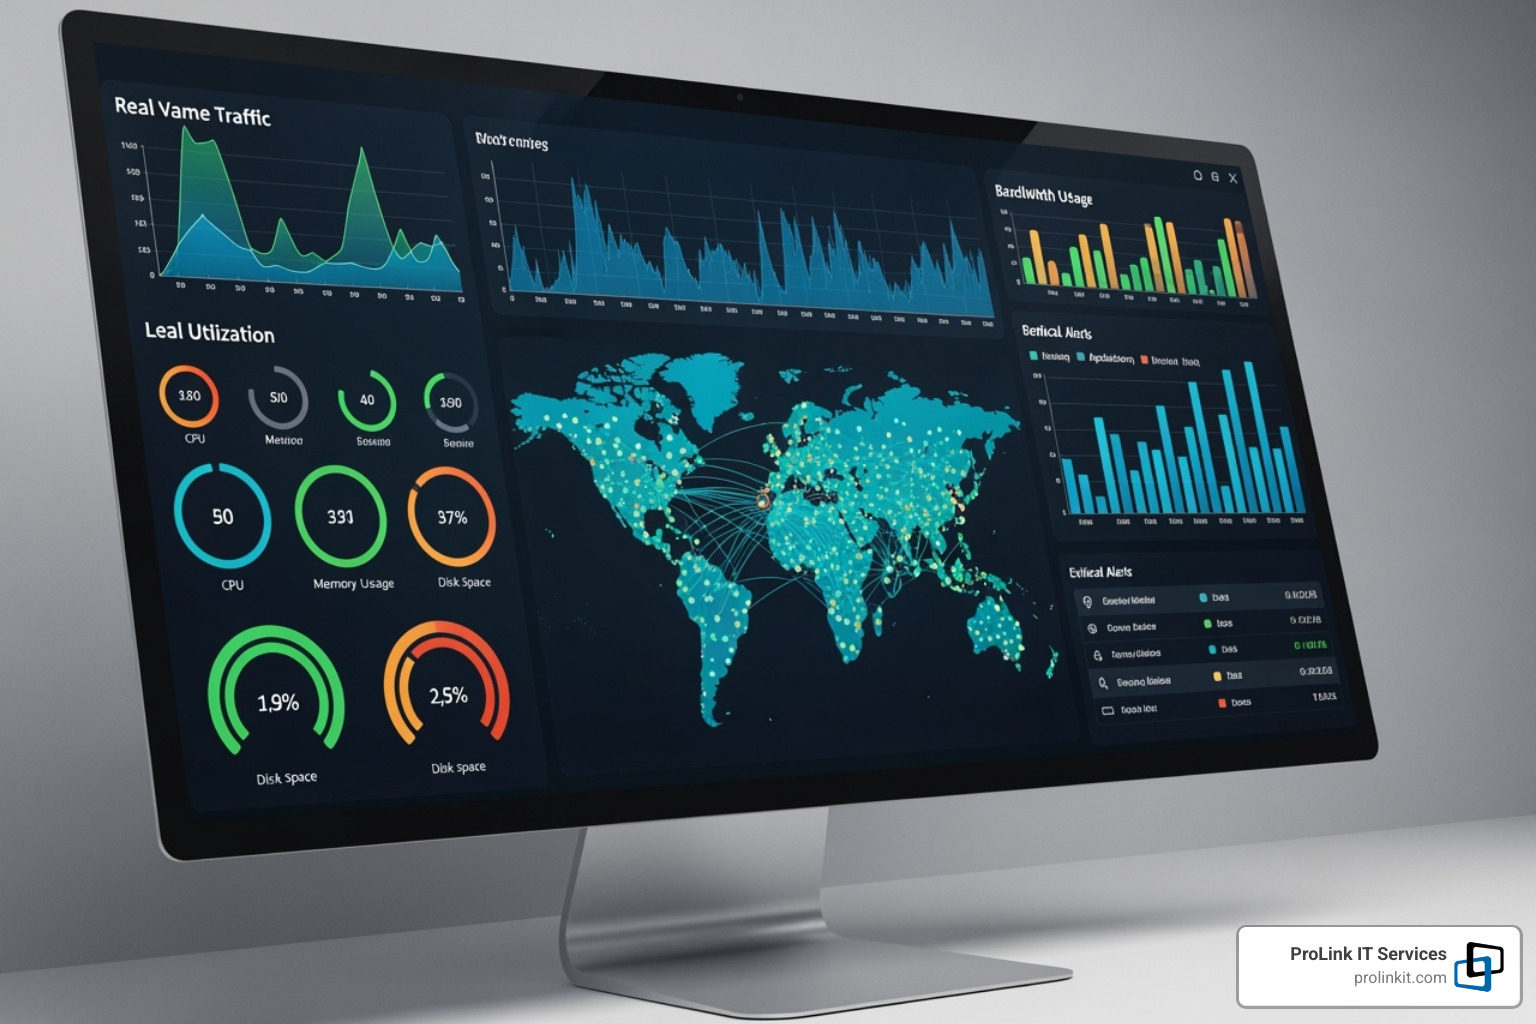
Icinga is a modern fork of Nagios, offering its power with a modern web interface and a RESTful API for easier integration. Its rule-based configuration simplifies managing growing networks by automatically applying monitoring to new devices. It’s compatible with Nagios plugins, making migration easier. Icinga also has better native visualization, integrating with databases like Graphite and InfluxDB for rich historical analysis. For a modern alternative to Nagios, see the Icinga 2 Download page.
Prometheus
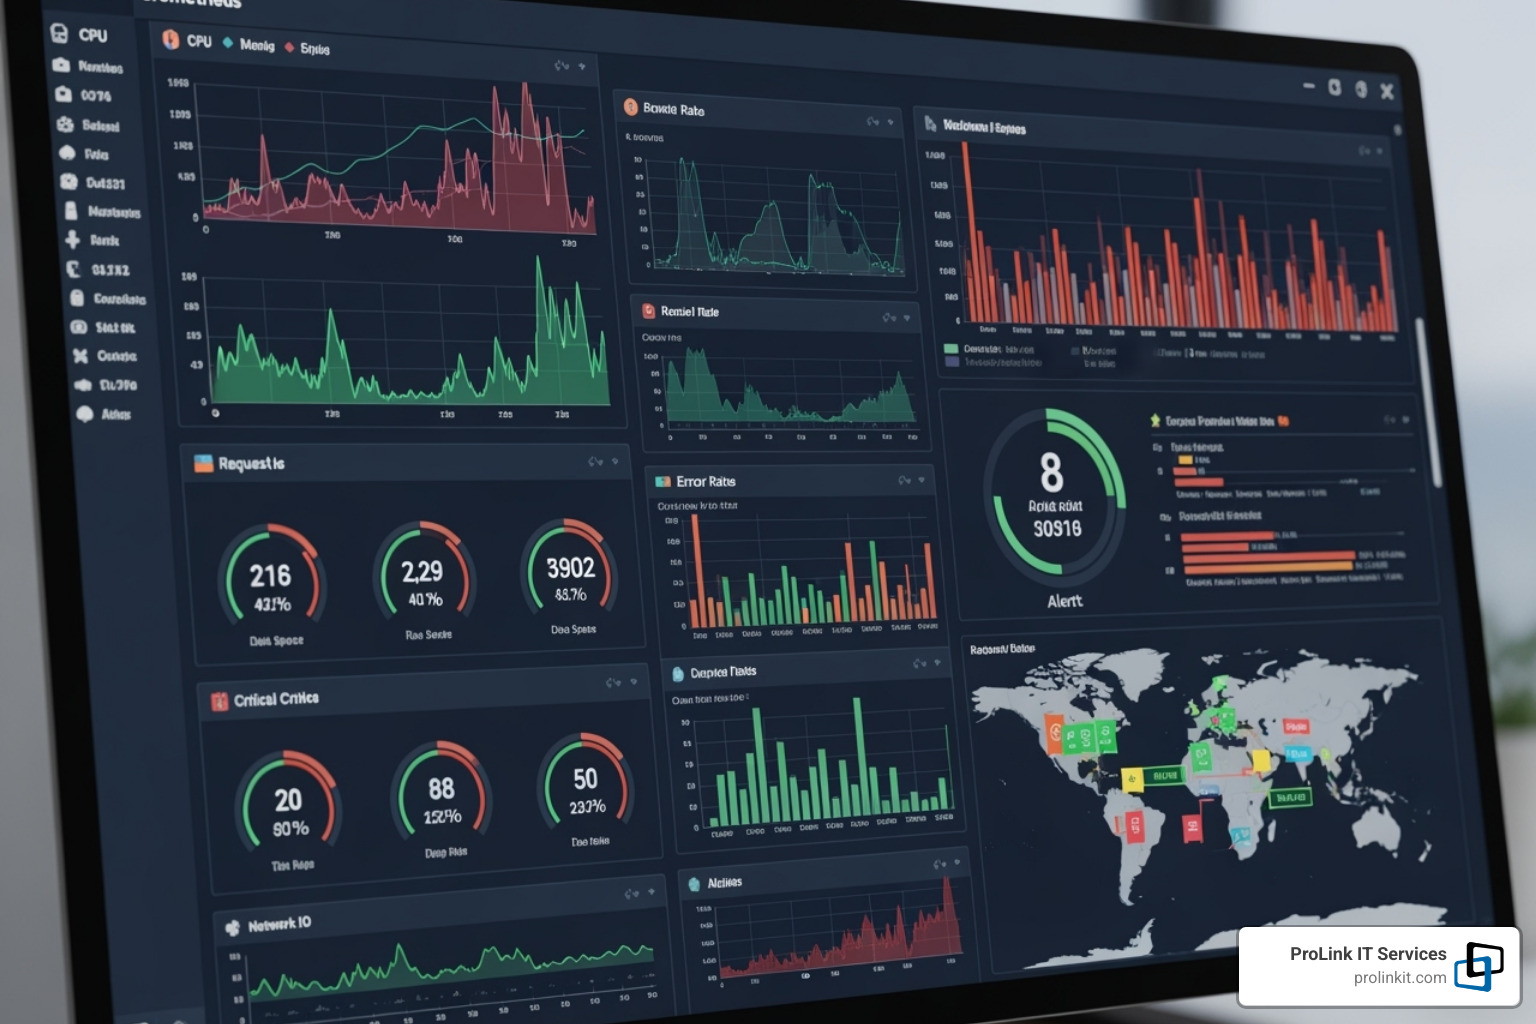
For cloud-native environments with containers, Kubernetes, or microservices, Prometheus is the standard. It pulls metrics from services, an approach ideal for dynamic infrastructures. Its powerful PromQL query language allows for sophisticated alerting based on trends, not just simple thresholds. While its own interface is basic, Prometheus shines when paired with Grafana for stunning, interactive dashboards. Its Alertmanager component intelligently groups and routes notifications, reducing alert fatigue.
Cacti

Cacti excels at network performance graphing. Built on RRDTool, it’s designed to collect and visualize time-series data from network devices. Its template-based approach and strong SNMP integration make it efficient for monitoring many similar devices, saving hours of configuration. Cacti’s focus is on historical data visualization, helping admins spot trends, identify bottlenecks, and plan for capacity. Learn more on the Cacti Project Page.
Matching the right tool to your needs is key to success in the network monitoring system open source ecosystem.
How to Choose the Right Tool for Your Business
Choosing the right network monitoring system open source solution depends on your unique situation. Consider these key factors before making a decision:
-
Network Size and Complexity: For a small business with a few dozen devices, a simpler tool like Cacti may suffice. For large, multi-site networks, you’ll need the scalability of a tool like Zabbix.
-
Environment Type: If your infrastructure is cloud-native or containerized (using Kubernetes or Docker), Prometheus is the essential choice, as it’s designed for such dynamic environments.
-
Team’s Technical Expertise: Be realistic about your team’s skills. Tools like Nagios Core require deep Linux and scripting knowledge, while Zabbix has become more user-friendly. A mismatch here can lead to implementation failure.
-
Integration Requirements: Your monitoring tool must work with your existing systems, like ServiceNow or Grafana. Look for tools with robust APIs, such as Zabbix and Icinga.
-
Community and Support: An active community means more resources and faster bug fixes. For critical systems, check if paid commercial support is available for guaranteed response times.
-
Long-Term Viability: Choose a project that is actively maintained with a clear development roadmap to ensure it will grow with your business.
The best solution aligns with your network, team, and long-term goals. If these considerations feel overwhelming, our Expert IT Consultancy Services for Optimal Business Solutions can help you steer the complexities and implement a solution that works for you.
Frequently Asked Questions about Open-Source Network Monitoring
Here are answers to common questions about network monitoring system open source solutions.
Are open-source network monitoring tools really free?
The software license is free, but that doesn’t mean there are no costs. You avoid hefty licensing fees, but you must account for operational expenses. These include:
- Hardware or cloud resources to run the software.
- Time for setup and configuration, which can be substantial.
- Staff training to use the tools effectively.
- Optional paid support for mission-critical environments.
Even with these costs, the Total Cost of Ownership (TCO) is typically far lower than proprietary alternatives. You trade license fees for control over your budget.
How difficult are these tools to install and maintain?
The difficulty depends on the tool and your team’s technical skills. Nagios Core, for example, is challenging, relying on text-based configuration and requiring strong Linux knowledge. In contrast, Zabbix has dramatically improved its user experience with templates and guided setup, making it more approachable. Prometheus has its own learning curve with its pull-based model and PromQL, which is valuable for cloud-native environments.
Once running, maintenance involves server health, updates, and configuration adjustments. A well-implemented system requires effort upfront but can become low-maintenance over time.
Can open-source tools monitor secure or enterprise environments?
Yes. Major organizations like Dell, Salesforce, and NASA’s International Space Station rely on these platforms. The European Space Agency uses Zabbix to monitor the Columbus lab on the ISS. These are enterprise-grade, not hobbyist, solutions.
Security is a core feature. These tools support secure protocols like SNMPv3, offer role-based access control, and benefit from transparent code that allows the global community to find and fix vulnerabilities quickly. Scalability is also a given, with tools like Zabbix handling tens of thousands of devices.
Proper implementation is key to security and reliability. For more on securing your infrastructure, read our guide: 24/7 Protection: How Network Security Services Keep Your Data Safe.
Get Expert Help with Your Network Monitoring
Open-source network monitoring tools offer enterprise-grade functionality without the high licensing fees. However, implementing these powerful solutions correctly requires expertise. The software may be free, but proper configuration, integration, and optimization are complex tasks that determine success.
Like a high-performance car, these tools need expert tuning to perform optimally. That’s where our expertise becomes invaluable.
At ProLink IT Services, we have years of hands-on experience with network monitoring system open source platforms. As a veteran-owned business, we bring discipline and integrity to every project, acting as your partner to ensure your monitoring solution works as intended. We understand that every network is different, from a small office in West Jordan to a multi-site operation across Utah.
Here’s how we help you succeed:
- Tool Selection: We guide you to the right tool for your specific needs, whether it’s Zabbix, Prometheus, or another solution.
- Seamless Implementation: Our experienced team handles the complex setup, configuration, and integration, ensuring everything works together smoothly.
- Ongoing Management: We keep your system optimized and updated, providing the insights you need for smart decision-making.
- Actionable Intelligence: We help you turn raw monitoring data into intelligence that drives business value.
Don’t let implementation complexity stop you from leveraging these powerful tools. Partner with us to achieve better visibility, fewer surprises, and optimal network performance.
Learn more about our Network Management services and find how we can help you harness the full power of open-source network monitoring for your business.